The “rising floor problem” complicates prevalence modeling and provides insights into the increasing toxic load imposed on children today
Apr 19, 2026
I. A perceptive question
In January, I presented some of my research on autism at a conference in Connecticut.
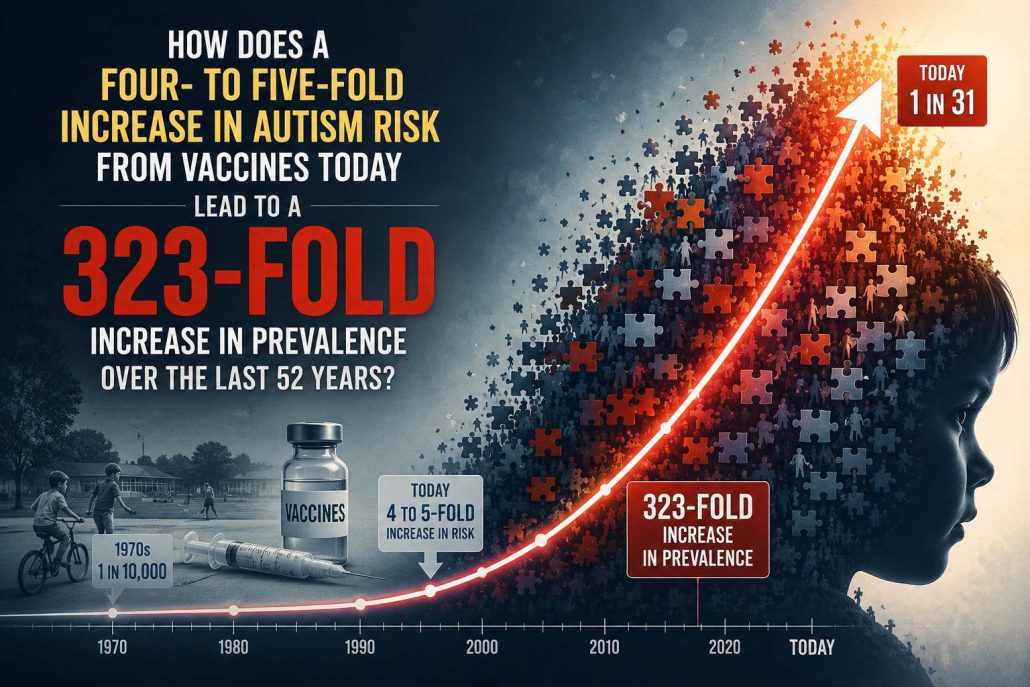
I pointed out that autism rates have increased 32,158% in the last 52 years (from 1 in 10,000 children with autism in 1970 to 1 in 31 in 2022). I noted that I’m the only person who cites this figure even though everyone has access to this information.
A hand went up from an esteemed participant in the conference followed by a question that went something like this:
I saw your Senate testimony and read your work and I think you’re probably right about vaccines increasing autism risk. But the studies you cite on vaccines show that they increase autism risk by anywhere from 300% to 400%. Okay fine. But how do you get from a 300% to 400% increased risk of autism from vaccines to a 32,158% increase in autism prevalence in the population? I’ve tried to do the math a lot of different ways and I cannot get from the individual increased risk to the much larger increase in population prevalence that you cite.
It’s the most thoughtful question I’ve ever gotten about my work because it takes the best existing data seriously while also interrogating patterns that still don’t make sense.
I said I didn’t know the answer but I would figure it out and get back to him. I’ve been working on this problem ever since. Now I think I have the answer and along the way I stumbled upon a few new insights into autism prevalence modeling that I don’t think anyone has ever mentioned before.
Let’s work through it piece by piece.
Editor’s note: Throughout this essay I use the words “risk” and “odds” interchangeably even though they are somewhat different concepts. Risk is the number of people who develop the condition divided by the total number of people in the group. Three children out of 100 develop autism → risk = 3/100 = 0.03. Odds is the number of people who develop the condition divided by the number who don’t. Three children out of 100 develop autism, 97 don’t → odds = 3/97 = 0.0309. As you can see, for conditions where the prevalence is low (single digits), the two measures are roughly equal and thus for my purposes here, can be used interchangeably. When you take the ratio of risks you get RR (generally used in prospective cohort studies); when you take the ratio of odds you get OR (used in retrospective case-control studies).
II. The prevalence data
Darold Treffert at Winnebago State Hospital in Wisconsin was one of the first people to measure autism in the general population. His study, “Epidemiology of Infantile Autism,” published in Archives of General Psychiatry in 1970, showed an autism rate of less than 1 in 10,000 children (less than 0.01%).
According to a study by the EPA, sometime around 1987 the autism rate in the United States began to skyrocket.
The most recent report from the Autism and Developmental Disabilities Monitoring Network (ADDM) showed that 1 in 31 eight-year-old children in the U.S. in 2022 were on the autism spectrum (Shaw et al. 2025). That’s a 32,158% increase in the last 52 years.
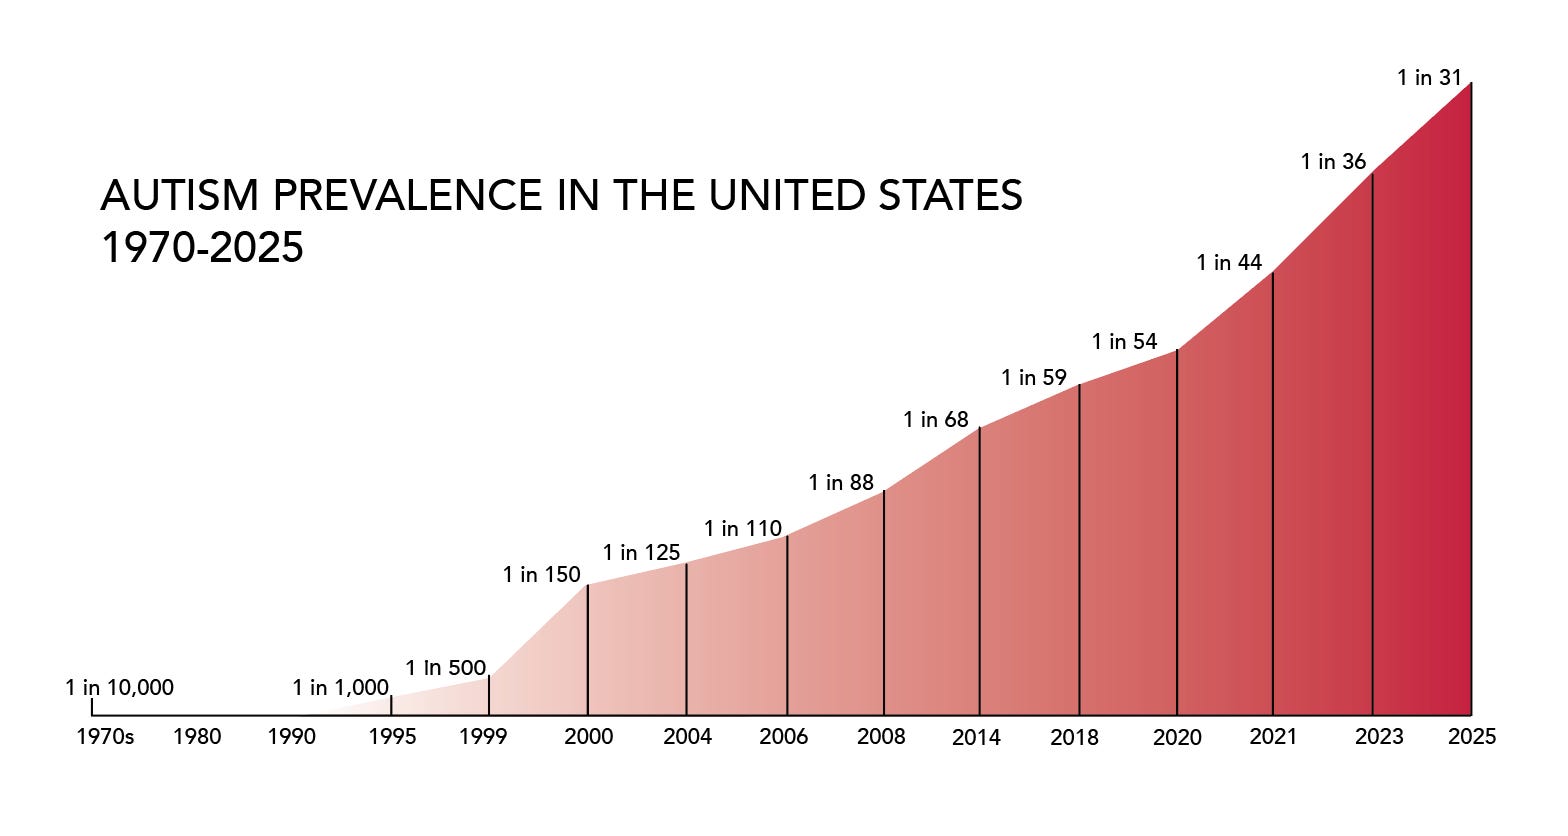
In many blue states the rates are even higher.
III. Rising prevalence is NOT the result of changing diagnostic criteria
Some will claim that rising autism rates are a product of changing diagnostic criteria. The evidence does not support this.
As most of my readers already know, high quality studies by Byrd et al. (2002) and Hertz-Picciotto & Delwiche (2009) concluded that better awareness, changes in diagnostic criteria, and earlier age of diagnosis only explain a small fraction of the rise in autism prevalence.
In addition, there are about 50 studies on how changes to the DSM definition of autism since 1980 have impacted prevalence estimates. I’ve reviewed them all and the quick summary is that:
- The DSM-III definition of autism in 1980 was too restrictive and significantly undercounted true autism prevalence;
- The DSM-III-R (1987) substantially broadened criteria;
- The DSM-IV (1994) partially narrowed core criteria while expanding the spectrum;
- DSM-IV-TR (2000) made no changes to the diagnostic criteria for autism; and
- The DSM-5 (2013) narrowed autism criteria, producing a reduction in autism prevalence estimates by about 20%.
The bottom line is that we are still likely UNDERCOUNTING true autism prevalence based on the current DSM-5 definition of autism.
IV. The iatrogenic risk data
Mawson et al. (2017a) in a study of homeschool children in Florida, Louisiana, Mississippi, and Oregon found that vaccinated children had 4.2 times higher odds of an autism diagnosis compared to unvaccinated children (OR = 4.2; CI: 1.2, 14.5).
Mawson et al. (2017b) found that preterm birth, coupled with vaccination increases the odds of neurodevelopmental disability by more than 12-fold compared to preterm birth without vaccination.
Hooker & Miller (2021) in a study of three medical practices in the U.S. found that:
• Vaccination increases the odds of developing autism 5-fold.
• Vaccination in the absence of breastfeeding increases autism risk 12.5-fold.
• Vaccination in addition to C-section birth increases autism risk 18.7-fold.
Mawson & Jacob (2025) using Florida Medicaid data found that children with 11 or more visits to the doctor that included vaccinations were 4.4 times more likely to have been diagnosed with autism than those with no visit for vaccination (95% CI: 2.85, 6.84).
These are the best numbers that exist on the increased risk of autism as a result of vaccination — somewhere between 4.2- and 5-fold increased risk.
But the problem remains… how does one go from a 4.2- to 5-fold increased risk for EACH INDIVIDUAL CHILD to a 323-fold increase in autism prevalence in the POPULATION since 1970? (Technically it’s a 322.58-fold increase but I rounded up to 323 for the sake of simplicity.)
For those who prefer to think in terms of percentages, the question is: how does one go from a 320% to 400% increased risk for EACH INDIVIDUAL CHILD to a 32,158% increase in autism prevalence in the POPULATION? Just a reminder for anyone who needs it: (Fold increase − 1) × 100 = percentage increase. So a 4.2- to 5-fold increased odds of autism from vaccines = 320% to 400% increased odds.
For now we are setting aside the increased risk of premies + vaccines (12-fold increased risk), absence of breastfeeding + vaccines (12.5-fold increased risk), and c-section birth + vaccines (18.7-fold increased risk). However those are just variations on the same mathematical problem — how does one get from a 12-, 12.5-, or 18.7-fold increased individual risk to a 323-fold increased prevalence in the population?
V. The overlooked statistic that unlocks the mystery
I went back through Mawson et al. (2017a), Hooker & Miller (2021), and Mawson & Jacob (2025) — the three best vaccinated vs. unvaccinated studies ever conducted — and discovered something astonishing: the autism rate in the UNVACCINATED childhood population today is 100 times higher than in the childhood population studied in Treffert (1970).
The autism rate in the UNVACCINATED population in recent studies:
Mawson et al. (2017a) = 1.15% (the published study shows 1.0% but I believe that’s a rounding error. When I re-run the calculation using the reported numbers [3 autism cases out of 261 unvaccinated children] it comes out to 1.15%)
Hooker & Miller (2021) = 0.95%
Mawson & Jacob (2025) = 1.1%
Heretofore, I think people overlooked the autism rate in the unvaccinated population because the rate in the vaccinated population is so much (4.2 to 5 times) higher. And the people pushing the ‘autism is genetic’ narrative may have lulled us into thinking that a 1% autism rate is the “natural” (genetic) rate in the population. But remember, the autism rate in the childhood population in 1970 was less than 0.01% and now the autism rate in the unvaccinated population is 100 times higher than that.
So, I’ve stumbled upon a “rising floor problem” which is that every recent study of vaccines and autism is measuring odds ratios against a contaminated baseline. It seems that the “unexposed” control group is exposed to something toxic, just not vaccines in those children per se.
VI. Recalculating odds ratios now that we know about the rising floor problem
Understanding the rising floor (as a result of widespread toxic exposures in society) unlocks a number of new insights into the autism epidemic:
A child born in 2014 (who turned 8 in 2022 — this is the latest data that we have available from ADDM) has a 1 in 31 chance of developing autism (3.2%).
I now realize that the proper comparison to understand the dynamics of the autism epidemic is NOT between a vaccinated and unvaccinated child born in 2014 because the unvaccinated child in our current era has been exposed to a lot of toxicants as well (we’ll explore this more in a moment).
The proper comparison is between the childhood population in the most recent ADDM study (Shaw et al. 2025) and the childhood population in the first autism prevalence study (Treffert, 1970). Said differently, the proper comparison is between a child born in 2014 who has a 1 in 31 chance of developing autism and a child born between 1950 and 1955 (Treffert, 1970, studied the incidence of autism in an entire state population age 12 during the period 1962 to 1967) who had a less than 1 in 10,000 chance of developing autism. The odds of developing autism in a child born in 2014 are more than 323-fold higher than in a child born in 1950.
When one makes this comparison between the two time periods, the odds ratio (323) and the overall prevalence increase (32,158%) match. So the answer to the question posed at the Connecticut conference is this: a 4- to 5-fold individual OR today becomes a 323-fold population increase when the comparator is corrected from a contaminated 2022 baseline to the 1962 to 1967 pre-epidemic baseline. (We’ll deal with challenges to this logic in a moment.)
If we continue this line of reasoning, my hypothesis is that the odds ratio of developing autism between a vaccinated child born in 2014 and an unvaccinated child born between 1950 and 1955 is probably between 420 and 500 (41,900% to 49,900% increased odds). Independent researchers likely missed this before because previously no one had identified the rising floor problem.
By the same token, I hypothesize that the odds ratio of developing autism between a child born in 2014 who was born via c-section, vaccinated, and not breastfed vs. a child born between 1950 and 1955 who was delivered vaginally, breastfed, and not vaccinated is probably around 1,870 (186,900% increased odds) — likely the highest odds ratio you will ever see for any measurable harm on planet Earth other than perhaps enlisting in a war.
(To be clear, Hooker & Miller 2021 calculate odds ratios for “c-section birth” and “not breastfed” separately. I was just looking to come up with a “highest risk” modern cohort vs. a “lowest risk” historical cohort. I use the odds ratio from the higher risk category, c-section birth, rather than absence of breastfeeding; however I’m not implying an interaction effect between these two categories even though there very well could be one. The 100-fold higher OR from vaccines in these scenarios is what we would see if the comparison group had an autism rate of about 0.01% which is what we see in Treffert, 1970, rather than the 1% rate we see in the unvaccinated population today.)
VII. Fine tuning the revised estimates of odds ratios between time periods
Treffert, 1970, actually had 3 groups in his study on autism prevalence: Group A (“classic infantile autism”), Group B (a later onset psychotic disorder that sounds like regressive autism), and Group C (“probably psychosis” along with “deafness, aphasia, or other evidence of brain damage” — it is unclear to me whether these are autism comorbidities or a different diagnosis altogether). Treffert writes:
Of the cases, 25% fit the definition of classic early infantile autism (group A);
56% fit into group B, and
19% into group C.
In prevalence terms these work out to:
Group A, 0.775 cases per 10,000 children (that’s where we get “a prevalence of less than 1 in 10,000 children” as the shorthand for this study).
Group B, 1.736 cases per 10,000 children.
Group C, 0.589 cases per 10,000 children.
(Apologies for using three decimal places, however if I round them off it breaks the math later so I thought it better to be precise.)
If one only uses the prevalence estimate for Group A as the point of comparison in the model I built in Section VII above, the odds ratios for harms from vaccines and other toxicants between the two eras rises from 323 to approximately 416 — a roughly 29% increase from my initial calculation.
Using Groups A + B (0.775 + 1.736 = 2.511 autism cases per 10,000 children) as the baseline comparator the fold-change drops from 323 to about 129 — a reduction of roughly 60% from my estimate in Section VII.
Using Groups A + B + C (3.1 autism cases per 10,000 children) as the comparator the fold-change drops to about 104 — a reduction of roughly 68% from my estimate in Section VII.
However an OR of 104 is still more than twenty-fold higher than the odds ratios published in Mawson et al. (2017a), Hooker & Miller (2021), and Mawson & Jacob (2025) — which are already so high that the mainstream scientific and medical community refuses to discuss the contents of these studies and resorts to ad hominem attacks instead.
VIII. What explains the rising autism rate in the unvaccinated population?
The roughly 1% autism rate in the unvaccinated population today is likely the effect of the 86,000 industrial chemicals registered for use in the U.S. that are generally not regulated at all (this includes some of the toxicants studied by CHARGE, MARBLES, SEED, and EARLI).
Bioaccumulation means that these toxicants can become more concentrated within a species over time and biomagnification means that these toxicants can become additionally concentrated as they move up the food chain.
We may be seeing teratogenic effects as well — whether from vaccines or other toxicants. A teratogen is a toxicant that causes developmental abnormalities in a fetus or embryo. It seems plausible that aluminum and other ingredients in vaccines could be teratogens although that research has not been conducted because Pharma would never allow government to fund that sort of research and any professional who studied that would soon be censored and blacklisted by academia, scientific journals, government, and the media.
A recent study (Korolenko et al., 2026) showed intergenerational effects from a single exposure to a toxicant (vinclozolin, a fungicide) that impacted offspring for all twenty-three future generations of animals examined.
The rising autism rate in unvaccinated populations is consistent with intergenerational teratogenic effects — epigenetic modifications, maternal immune activation, and microbiome disruption — transmitted through the maternal lineage from prior decades of toxicant exposure. That could be from vaccines or from some combination of the 86,000 chemicals in use, EMF/RFR, nuclear weapons testing in the 1950s and 1960s, coal-fired power plants, etc.
If this explanation is correct, no single birth cohort today can serve as a clean unexposed control for any subsequent cohort, because each generation inherits an already-modified biological substrate from the previous one. The autism epidemic is thus not merely a story of direct individual exposure; it may also be a story of accumulated biological harms across generations.
IX. A new model of the autism epidemic
So the model of the autism epidemic that I’m building looks something like this:
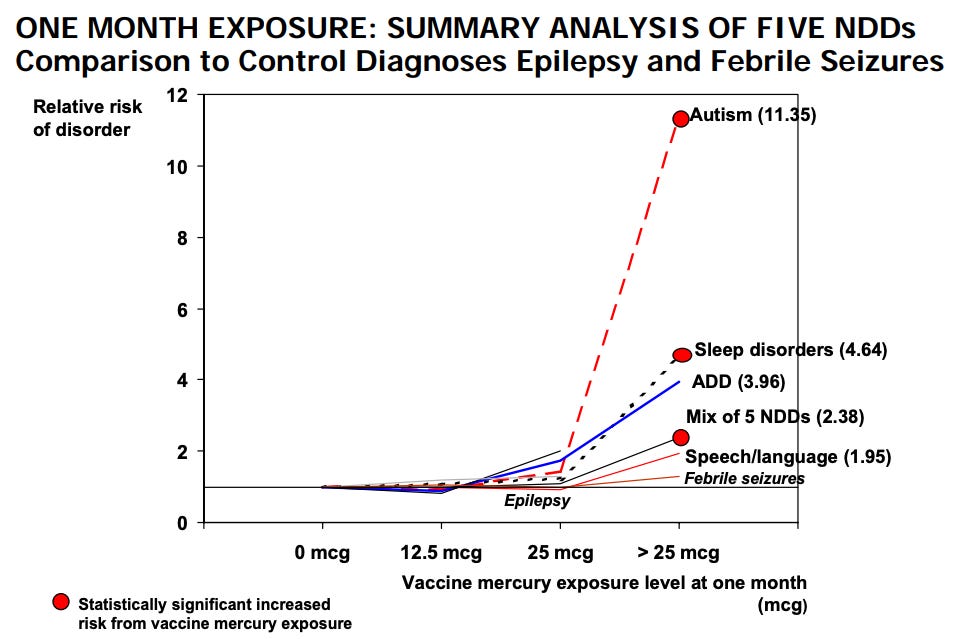
Vaccines clearly increase autism risk. The CDC’s own internal research in 1999 showed that those with the highest mercury exposures in the first month of life had 11.35 times higher autism risk (see report from SafeMinds). The removal of mercury from most vaccines in the early 2000s only made a small impact on autism prevalence because several aluminum-containing vaccines were added to the schedule soon thereafter.
Vaccinated vs. unvaccinated studies are a relatively recent phenomenon — they should have been conducted all along but never were. Once parents realized, in the late 1990s, that the necessary studies had never been done, they called for researchers to conduct vaccinated vs. unvaccinated studies for the first time. Only a handful of independent researchers stepped up to do this foundational work as mainstream academia and government were already captured by the pharmaceutical industry. All proper vaccinated vs. unvaccinated studies have shown statistically significant harms from vaccines.
By my count, 25 changes have been made to the CDC vaccine schedule since 1986 and 23 of them increased the total toxic load imposed on children. The only exceptions are the replacement of whole-cell DTP with acellular DTaP in 1997 which slightly reduced the rate of fatalities from the shot while still causing catastrophic harms to others and the withdrawal of RotaShield in 1999.
RoundUp Ready® seeds became widely available in the 1990s and so herbicide exposures vastly increased (Waldman et al., 2017).
More children are born underweight and early (premies).
More birth drugs are used.
More children are delivered via c-section.
More moms use formula instead of breastfeeding because of aggressive marketing from formula companies and difficulty breastfeeding caused by toxicants in both mother and baby that make nursing more challenging.
As I showed in my thesis (2019), there is no regulatory system in the U.S., only the appearance of a regulatory system (we have regulatory theater, but 99.99% of chemicals are approved).
Over time the total allostatic load becomes overwhelming and children are the canaries in the coal mine whose bodies break first.
What we need is a whole-of-society approach to reducing toxicants, starting with eliminating vaccine schedules altogether (and offering, at most, three optional vaccines to those who want them). We also need reductions or bans of endocrine disrupting chemicals, fire retardants, toxic ingredients in plastics, herbicides/pesticides/fungicides, other pharmaceuticals (Tylenol, antidepressants), and EMF/RFR along with better regulation of pollutants in our air, water, and soil.
X. Criticisms, qualifications, and rejoinders
1. The strongest criticism of the work I’ve done here is that I’ve just switched from an individual risk model (Mawson et al., 2017a; Hooker & Miller, 2021; and Mawson & Jacob, 2025) to a population-based model comparing two time periods. Of course the odds ratio in this model matches the total societal increase over that time period because it’s a population-based model comparing two time periods!
Fair enough, but the rising floor problem is a genuinely unique and I think important contribution to autism prevalence modeling. A 0.95% to 1.15% autism rate in completely unvaccinated populations is astonishingly high — at least 100 times higher than what one would expect based on earlier modeling of autism prevalence. And the rising floor problem obscures the true increased individual and societal risks from vaccines over time so it’s instructive to correct for that.
2. It’s possible that the estimates in Treffert (1970) are an underestimate of true autism prevalence at the time. However, I’m reminded of this section in Andrew Solomon’s book, Far from the Tree (2012), where the former director of the National Institute of Mental Health, Thomas Insel (no friend of anti-vaxxers), “recounted a time during the 1970s when an autistic child was admitted to Boston Children’s Hospital; the chief of service called the residents together to observe him, reasoning that they might never see an autistic child again” (p. 261). THAT’s how rare autism was in the 1970s. Medical records from Leo Kanner’s practice also show that historically, autism was vanishingly rare. So it’s also possible that Treffert (1970) was an overestimate of autism prevalence at the time (particularly if one combines all three groups that he studied as the comparison group as I explained above).
3. It’s possible that in fact the “unvaccinated” population in Mawson et al. 2017a, Hooker & Miller 2021, and Mawson & Jacob 2025 were not unvaccinated but instead received some vaccines and their medical records were incomplete. Perhaps, but these scholars are very thorough and the results are consistent across three different study populations. So I don’t put much stock in the ‘actually vaccinated unvaccinated’ hypothesis.
4. The final obvious criticism is that there were high levels of pollution in the United States in the 1950s and 1960s, so it’s strange to use this cohort as the “uncontaminated” comparison group. Fathers and mothers smoked like chimneys exposing children to secondhand smoke; there were few if any regulations on emissions from factories and cars; lead was in gasoline; and DDT and other toxicants were routinely sprayed on crops, wetlands, and sometimes directly on children. Point taken. But isn’t it interesting then that children in that era had such lower rates of chronic illness than children today?
Rather than refuting my insights here I think this illustrates how much more toxic our environment and our bodies have become — that the bloated childhood vaccine schedule and other modern toxic exposures (endocrine disruptors, fire retardants, herbicides/pesticides/fungicides, EMF/RFR, and other pharmaceuticals) along with possible intergenerational effects from previous toxic exposures leave more than half of all children chronically ill today (as compared with single digits in the 1950s).
XI. Conclusion
I believe that the “rising floor problem” is a new and unique insight into autism prevalence modeling. The best available vaccinated vs. unvaccinated studies (Mawson et al., 2017a; Hooker & Miller, 2021; and Mawson & Jacob, 2025) show an autism rate of about 1% in the UNVACCINATED population today. That’s more than 100 times higher than one would expect from reading Treffert, 1970.
The rising floor problem obscures the true dynamics of the toxicological crisis we are in. Calculating odds ratios across eras shows that a child born today has a 323-fold higher risk of developing autism than a child born in the 1950s and a child born today who is vaccinated according to the CDC childhood vaccine schedule has a 420- to 500-fold higher risk of developing autism than a child born in the 1950s. Children who are born via c-section and/or are not breastfed face even higher risks.
The rising floor problem is explained by increasing toxic exposures across the whole population and possible intergenerational effects from toxic exposures in previous generations. While pollution was abundant in previous generations, the potency, persistence, and ubiquity of toxic exposures today have caused a massive increase in chronic illness in children.
We need a whole-of-society approach to massively reduce toxicants in society immediately and permanently. Unfortunately, in spite of a sea change election in 2024 and the inclusion of the Make America Healthy Again movement in the new governing coalition, toxic exposures in society have increased in the last year as some environmental protections have been rolled back by the Trump administration (e.g. the EPA’s reapproval of toxic dicamba, the glyphosate executive order, and a recent EPA decision to rescind pollution controls on power plants).
Regulatory, financial, and epistemic capture likely prevent the CDC and NIH from conducting this sort of modeling even though it is well within their technical capabilities and statutory obligations.
The bottom line is that we know how to bring down the risks of developing autism. Now we must summon the political will to implement the obvious and necessary reforms.
Blessings to the warriors. 🙌
Prayers for everyone fighting to stop the iatrogenocide. 🙏
Huzzah for everyone building the parallel society our hearts know is possible. ✊
In the comments, please let me know what’s on your mind.
As always, I welcome any corrections.
https://substack.com/home/post/p-186934758


